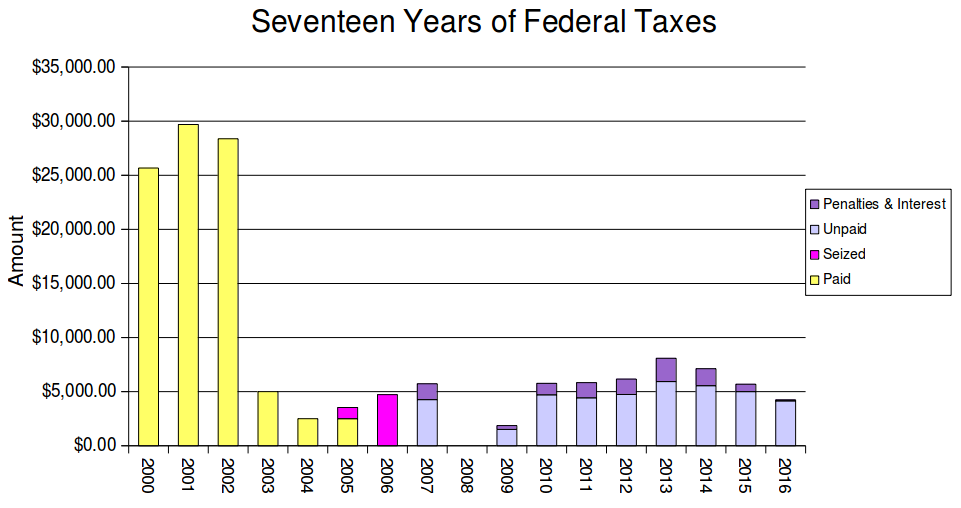
I was recently putting some finishing touches on my annual year-in-review post. One element of this has been a “Five Years of Federal Taxes” chart showing how much federal tax I’ve been assessed, how much of that I paid, didn’t pay, or was seized, and how much can be attributed to interest & penalties.
I decided I wanted to see how that looked on a longer scale, so in addition to that graph with the floating five-year window, I created another graph showing the fate of my taxes :

Before 2003, I was doing pretty well for myself in the post-dot-com-boom software industry, and paying plenty to Uncle Sam. In I decided I didn’t want to pay federal income tax anymore and quit my job so I could lower my income below the tax line. I still paid some FICA that year, though (the FICA amounts in the chart include both the employee and employer portions, so they correspond to my later SECA amounts).
In I decided to stop paying SECA (including some residual amount from that was included on my tax return). The IRS managed to seize what I resisted for that year, but since then they have pretty much let me be.
During the “Great Recession” of I had a hard time finding paying gigs, and my income suffered, but this also kept my taxes even lower.
How much tax have I managed to resist since I started? It’s hard to say for sure. You can count the dollars I’ve owed and not paid, but it’s harder to count the dollars I didn’t owe in the first place because of my decision to stay under the income tax line. To get a ballpark figure, you might just extrapolate from those first three years, and say I’ve resisted about that much each year since. So something in the neighborhood of $400,000.
