How you can resist funding the government →
about the IRS and U.S. tax law/policy →
how is tax law/policy/administration changing? →
“Lucky Duckies”
So back on , I made a big deal about the Tax Foundation’s determination that about 41% of U.S. households will pay absolutely no federal income tax at all this year — a number that’s gone up by about half in the last few years.
Almost all of these 41% are doing essentially what I’m doing — earning below the median income and taking deductions & credits.
So at first glance, it looks like low-income families are getting the best deal of all from the government’s tax policy.
But if you read left-leaning blogs or op-ed authors, you’ll see claims that the U.S. tax system favors the wealthy and that this has been getting worse and worse.
Who’s right?
Would you believe they’re both right?
The difference comes from looking at the federal income tax on one hand, and at the total tax burden on the other.
The payroll tax, a.k.a. FICA, takes a little over 15% of your wages starting with the very first dollar you earn.
There is no standard deduction or personal exemption, and you can’t hide your income from FICA by putting it aside in a 401k plan.
Most of this is designated a “social security” tax, with about a fifth of it called the “medicare” tax.
The theory behind these designations — “social security” and “medicare” — is that this is where your money is going: into accounts that will pay for your medical expenses and a retirement pension.
In reality, the money just goes into the same big bag the government uses to pay for everything else, and if you get anything back from the government at retirement this’ll be determined by the politicians in power then, not by any sort of contractual obligation based on how much you’ve been paying.
Back in , the government projected that they were going to start running out of money to pay for social security benefits eventually, so they’d better raise the “social security” tax rate.
But they didn’t take the extra money they raised with this higher tax and put it away to pay for social security benefits — they just went ahead and spent it, or used it as a cushion to help justify the recent reductions in federal income tax rates.
As a result, about three-quarters of us now pay more in FICA than in income tax.
There’s no question that what’s called a “social security” tax is just another tax to raise money for government spending of all sorts.
And while the federal income tax seems to give the poor a break, the payroll tax is its evil twin opposite: screwing the poor and giving the rich a free ride.
The “social security” portion of the FICA tax maxes out when your salary hits $87,000. Beyond that, you don’t have to pay any more.
So a person who makes $87,000 pays $10,788 in “social security” tax, a person who makes $125,000 pays $10,788, and a person who makes $300,000,000 pays $10,788.
And unlike the federal income tax, which taxes income from capital gains, interest, dividends, etc. the payroll tax only taxes wages.
If you work for a living, you get taxed — if you live off of a trust fund or investments, you don’t.
Also complicating the story are are state and local taxes, corporate taxes, excise taxes, and such.
Excise and sales taxes are also regressive taxes — that is, they tax the poor at a higher rate than the rich.
This is all at best tangential to the main thrust of The Picket Line — which is that, fair or unfair, progressive or regressive, your tax money goes to pay for things that are unjustifiable and resistance to taxation can be justified not from a personal feeling of getting ripped off or getting a worse deal than the fellow in the top hat and tails, but simply from not wanting to participate in activities you know to be wrong.
But I thought I should bring this up, because in my excitement to show how easy it is to legally avoid the federal income tax by lowering income, I risk being part of the deceptive chorus of people who like to claim that the U.S. tax system is somehow horribly unfair to the wealthy.
The Tax Foundation has been the best source of pithy press releases, reports and graphs about the “Lucky Ducky” phenomenon — that is, that there is an increasing number and percentage of people in the United States who don’t earn enough money to pay any income tax.
Alas, they see this as a problem, while to me it is a solution.
But anyway, they’ve got a new “Fiscal Fact” out that tries to make this point that we could lower the tax rates on all the income that is taxed now if only we would start taxing all that income that isn’t.
By their estimation, fully 60% of the income earned in the United States today is covered by credits, deductions, exemptions, or is an untaxed transfer or benefit, or is earned in the underground economy and undeclared, or is earned by people too poor to need to file tax returns in the first place.
In other words, only 40% of the income earned in the United States is taxed at any rate at all by the IRS.
They hope this shocking fact will encourage lawmakers to “broaden the tax base” — which is to say, make more of that 60% taxable, so they can lower the tax rates on the 40%.
This analysis does the traditional wealth-lobby think tank tax trick of pretending that the Social Security / Medicare / payroll / FICA tax doesn’t exist or doesn’t matter.
It’s pretty clear that much of the reason for the lower-income exclusion from income tax is the larger burden of FICA for people at a low income.
With the federal government siphoning off this FICA money into the general fund, and with none other than the President himself saying that the IOUs given in return are worthless, it’s hard to believe that FICA is anything but an additional form of income tax — like the federal income tax and the AMT.
Remarkably, though, the Republicans in Congress immediately thought of squeezing the poor in this way when it came time to try to find money to pay for the coming Katrina boondoggle (what? you expected them to look for offsetting spending cuts?):
Don’t worry, San Francisco, nobody is really going to call that bluff.
You’ll get your pork, and everywhere else with powerful enough congresscritters will too, and Halliburton will get its boondoggle cash to themeparkize New Orleans, and they’ll just put it on our tab as usual:
The Tax Foundation is hoping a few well-placed white papers will influence the powers-that-be to do something about all us Lucky Duckies.
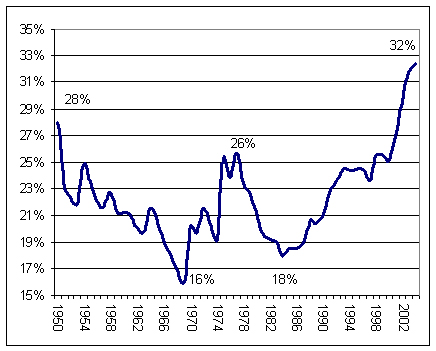
Percent of Tax Filers Who Owe Zero Federal Income Tax,
Tax Foundation economists estimate that in , some 42.5 million Americans (one-third of all filers) filed a tax return but had no tax liability after taking advantage of their credits and deductions.
Figure 1 shows the percentage of non-payers .
During that period, non-payers averaged 22 percent of all taxfilers.
Today, however, non-payers account for 32 percent of all taxfilers, a nearly 50 percent increase in the number of non-payers and a 160 percent increase in the number of non-payers .…
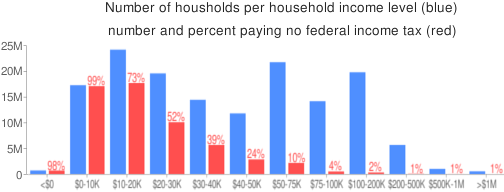
In addition to these non-paying filers, roughly 15 million individuals and families earned some income in but not enough to be required to file a tax return.
When these non-filers are added to the non-payers, they add up to 57.5 million income-earning households (sometimes referred to as tax units) who paid no income taxes last year.
Even 57.5 million is not the actual number of people because one tax return often represents several people.
When all of the dependents of these income-producing households are counted, roughly 120 million Americans — 40 percent of the U.S. population — are outside of the federal income tax system.
To me, this is not a problem but a solution, but the Tax Foundation sees it differently:
“While some may applaud the fact that millions of low- and middle-income families pay no income taxes, there is a threat to the fabric of our democracy when so many Americans are not only disconnected from the costs of government but are net consumers of government benefits.
The conditions are ripe for social conflict if these voters begin to demand more government benefits because they know others will bear the costs.”
Tax Foundation economists estimate that for tax year , a record 42.5 million Americans who filed a tax return (one-third of the 131 million returns filed last year) had no tax liability after they took advantage of their credits and deductions.
Millions more paid next to nothing.…
In addition to these non-payers, roughly 15 million individuals and families earned some income last year but not enough to be required to file a tax return.
When these non-filers are added to the non-payers, they add up to 57.5 million income-earning people who will be paying no income taxes.
Even 57.5 million is not the actual number of people because one tax return often represents several people.
When all of the dependents of these income-producing people are counted, roughly 120 million Americans — 40 percent of the U.S. population — are outside of the federal income tax system.
I hope you find yourself among the lucky duckies in this 40%.
I discussed how I was eager to be in that category of Americans who cost the government rather than support it.
If you believe a recent study by The Tax Foundation, that category includes about 60% of America.
They purport to divide America into five income quintiles and to show that while an average member of each one gets roughly the same amount of benefits from government spending, the richest quintiles pay far more taxes, so that the overall effect of government taxes and spending is essentially a transfer of wealth from people in the top 40% to people in the bottom 60%:
Their study is getting a lot of play in circles that have always suspected that the poor have sneakily rigged the system at the expense of the rich, right under the noses of the rich politicians and lobbyists and lawyers who run it.
But their report has significant problems.
For example:
While their summary claims to be talking about government spending “targeted” at certain people or groups, the study itself actually asserts that all government spending benefits individuals, not only direct government spending on people.
So, for example, if the government spends money on invading Iraq, the study says it has really given that money to Americans in the form of the Iraq War.
Furthermore, some of this spending, like military spending, or spending on the space program, is considered to be shared equally among households, so that, for instance, in the president of Boeing received a $135 benefit from the government in the form of his portion of government spending on the space program, and so did the President’s Senior Space Science Advisor, and so did I.
And I didn’t pay taxes for my share, so the space program is, by the study’s logic, in part a welfare program by which the government redistributes $135 from good taxpayers to leeches like me.
The study calls all government spending a “good” that the government is giving to someone.
The prisoner and the judge who sentenced him are both getting an equally-sized “good” from the government in the form of the justice system.
The lucky prisoner, paying almost no taxes on his 17¢/hour job stamping license plates, is therefore considered a winner in this great wealth transfer from the rich to the poor via government.
The study acknowledges that this divvying up of “public goods” and “quasi-private goods” equally among households is controversial.
But their solution to this controversy is not to acknowledge that some well-connected households benefit far more than others from government spending of this sort, but to include some tables showing that their calculations look very similar even if they don’t include any of this “public goods” and “quasi-private goods” spending at all!
This would be like the owner of a baseball team saying “we won every game (144 wins, 0 losses) we played this year, if you include in the victory category those games in which our opponents scored more runs than we did (91 games).
We know this is a controversial method of counting, so for the skeptics among us we will also include the figures with those games omitted (53 wins, 0 losses), which leads to an essentially identical result.”
Indeed, the report is full of absurd and naïve assumptions about the pure nature of government spending that would make a communist blush.
Here’s a good one: “Policymakers crafting spending programs clearly aim to supply valuable outputs to households, not simply to make payments to inputs such as defense contractors, road builders or police officers.”
The study must make assumptions like this so it can ignore that the real beneficiaries of government spending are often the politicians who authorize it and the recipients of the spending:
“The basic purpose of government spending is to provide households with valuable outputs of goods and services — such as pollution controls to improve the environment, armies to provide protection from foreign nations, and courts to adjudicate disputes and maintain the rule of law.
These represent the outputs of government spending.”
And each of those “outputs” are counted by the study as benefits — “government spending distributions” — that are “supplied to households by the state” as if they were direct cash payments to the households that offset their taxes!
This is a conservative, free-marketish think tank saying these crazy things!
So, for instance, the money the government spends to build Senator Stevens’s “Bridge to Nowhere” isn’t a benefit that taxpayers are giving to Senator Stevens, or to the contractors who build the bridge, or to the lobbyists who made it possible, but is, according to the study, a benefit the government is paying to us in the form of a nice bridge.
Similarly, Bill Clinton’s pension and secret service protection isn’t a benefit the government is paying to him, but a benefit the government is paying to the American people in the form of an inducement it allows us to offer people of Clinton’s caliber in the hopes of getting them to work for us.
But some government spending is considered a private good, one that accrues to individuals depending on their circumstances.
For instance, the study says that interest paid on the national debt is a benefit that goes to holders of government bonds who receive that interest, and government spending on food stamps goes to the people who get the stamps.
Some of their assumptions seem questionable, though. For instance, government spending on higher education isn’t considered a public good but is considered to be given to “current enrolees of colleges and universities” — a suspect assumption, and one that makes full-time students (with correspondingly low incomes) out to be the recipients of government spending much of which benefits educational institutions, their employees, and future students.
This is another part of what the study characterizes as a transfer of wealth from the rich to the poor.
The study uses unusual definitions of “income” and doesn’t define them clearly, so it’s difficult to determine just who is categorized as belonging to the different quintiles.
For instance, if you don’t work for a living but just live off of your investments in one of the homes you own, are you in the low income quintile even though you’re rich?
(In one appendix, they present a table that shows how their numbers change if corporate income taxes are assigned to owners of capital, comparing this to the numbers under their default assumption that employees of corporations bear 70% of this tax burden.
Under the new numbers, the tax rate for the lowest quintile rose — indicating to me that there must be many people in that category who don’t have much “income” but do have a lot of assets.)
Some of the confusion comes from a deliberate distortion made for sketchy p.r. reasons:
“The final decision to present results on the basis of household cash money income with equal number of persons was chosen largely for the purposes of clarity when presenting results to non-technical audiences such as policymakers, journalists and the general public.
When placing themselves into an income category, most non-economists would likely choose based on a definition of income that broadly corresponds with the measure of cash money income used in the current study.”
The study notes that “[i]n general, federal government spending is more sharply tilted toward lower-income households, due to the large amount of federal transfer payments to lower-income households through Social Security, Medicare and Medicaid.”
There’s a problem that the study acknowledges:
People who retire and get Social Security are treated as low-income spending recipients, but while they were still working and not receiving Social Security they were treated as higher-income.
How much of the study’s implied income-class redistribution can really be explained by just the normal age-related redistribution of the Social Security system?
In other words, if a middle-class worker pays payroll taxes, and a rich retiree with no income gets social security, is this really fairly categorized as a redistribution of wealth from the middle class to the poor?
The study’s authors make some effort to address this in an appendix, but I wasn’t convinced that they’d really addressed the problem.
The study divides up Americans into quintiles, each containing an equal number of people, but then through most of the study it analyzes and reports results for “households” and not for people.
The highest-income quintile contains only 60% as many households as the lowest-income quintile because people in the lower-income quintile are more likely to be young singles, or retired without children, whereas high-income folks are more likely to be dual-income with kids.
The study addresses this and provides some alternate data, but this can be confusing.
For instance, if every household gets $135 in government spending because they get a share in the glory of another space shuttle launch, but there are 40% fewer households in the top quintile than in the bottom, then it can appear like the government is spending more to launch space shuttles for the poor than for the rich, if you fail to read the data carefully.
The study deliberately excludes state lotteries from consideration, while including just about every other tax under the sun.
I wonder why?
Could it be that such lotteries largely function as a government-mediated transfer of wealth from the poor to the rich and would mess up their numbers?
Note: since I read the working paper , and since I posted my response here, the Tax Foundation has issued a slightly different version that adds a section in Appendix A that addresses “Alternative Allocations of Public Goods and Quasi-Private Goods.”
This section includes tables that show how some of their results change if you assume one particular non-equal distribution of benefits from such spending, one in which the benefits accrue to households in proportion to household wealth.
This assumption doesn’t have much more empirical backing than the default assumption of the paper (that the benefits from such spending are equivalent to the amount of the spending and accrue to all households equally), but something like it seems to me to be a more likely scenario.
Although this may help remedy the problem of the assumptions behind the apportioning of the benefits of government spending, it seems to me that at least as serious and distorting a problem is the assumption that $1 in government spending means $1 in benefits all around.
The paper uses the example of a fireworks display as a public good that benefits everybody equally, so that if the government taxes John $1,000 and taxes Jane $2,000 to put on a fireworks show that costs $3,000, this is considered equivalent to the government redistributing $500 from Jane to John.
The problem is that this model doesn’t care if the government puts on the fireworks show in the middle of the day, on the dark side of the moon, or whether John and Jane wanted a fireworks show to begin with.
John and Jane may just end up feeling $1,000 and $2,000 poorer, compensated in no way by the government’s hope that they enjoy the light show.
Since I posted my criticism, the Foundation rushed out a new appendix section to the report and a FAQ, and Andrew from the Tax Foundation left a set of comments on The Picket Line to try to explain away the problems I found.
These new explanations, though, don’t much impress me.
There’s a lot about how the approach they chose to use with the data has a long and respectable history in decades of public finance scholarship, which may very well be true for all I know, but I was hoping for more than an appeal to authority in response to what I thought were pretty basic substantive criticisms.
And there’s a lot of dishonest straw-manning of my arguments, which is also disappointing.
What it comes down to is that the best you can say for the report is that the Tax Foundation may have come up with some intriguing numbers based on some imperfect methodologies in an area of fiscal studies where imperfect methodologies are about all we have.
However, they lose my respect by trumpeting their study with language and graphs that distort this and that make claims for the study that go way beyond any it has a right to assert:
Indeed, as the report would have it, we are a nation of a minority of taxpayers and a majority of “tax consumers”!
This is just simply a dishonest description of the data they present.
They do not show that 60% of Americans “receive” more from the government than they give it, nor that they are the net beneficiaries of “redistribute[d]” “income”.
This sort of description is the result of making all government spending the one-to-one dollar benefit equivalent to somebody of money taken from them in taxes.
Thus, a person’s “net tax burden” becomes the difference between what they pay and what the government spends on their behalf (including all government spending, not just benefits paid to that person).
To see how this methodology can lead to crazy results, note that if the government doubled the amount of taxes it collected from each of us and then spent all this new money to have the face of George Washington engraved with lasers on the surface of the moon, by the standards of this Tax Foundation report, the result of this would be that 60% of America would see their “net tax burden” fall even though each one of them saw their actual tax burden double!
In fact, the government could take all of everybody’s money, spend it on some crazy thing like this, and the Tax Foundation would consider it a redistribution of wealth from the rich to the poor by which 60% of Americans would be judged to be “tax consumers” benefiting from income redirected from the taxpayers in the upper 40%.
Because taxes and spending exactly cancel out, no matter how much the government takes in in taxes, the sum total of the “net tax burden” over the country as a whole is always zero (or would be if there were a balanced budget).
That is a remarkable discovery!
In fact, since budget deficits have been popular lately, there is more government spending than tax revenue, and the nation’s “net tax burden” as a whole is less than zero!
Grover Norquist, you may retire!
The Tax Foundation isn’t humble about such limitations of its methodology, but rather it boldly suggests that its weird discoveries about “net tax burden” have important public policy ramifications when, for instance, assessing the progressivity of the tax code: “Any amount of progressivity can be achieved by some mix of tax and spending changes.”
In other words, if for some reason you have a hankering to make the tax code less progressive, you can make up for this by spending more money on “public goods” since this spending is inherently progressive!
If you spend more money on the military, it’s exactly as though you were taking money from the rich and giving it to the poor, so don’t feel bad if you raise the tax rates on the poor to compensate!
And this was all done in the most respectable traditions and practices documented in decades of fiscal incidence literature, so you don’t just have to take their word for it.
Richard Winchester calls our attention to a method that some self-employed people are using to successfully and legally escape social security taxes:
The first thing I looked for was “how many people who file taxes actually owed any federal income tax at all for ?”
In , Americans filed 134,372,678 income tax returns.
Of those, 90,593,081 (67.42%) were “taxable returns” — meaning those returns on which there was a “total income tax” for the year.
That is to say that 32.58% of those households who filed their tax returns owed no federal income tax at all in .
To clarify: this does not mean that they didn’t owe any extra when they filed their returns, but that they did not owe any federal income tax at all throughout the year.
If any had been withheld from their wages, they got every dime back as a refund.
If you’re in the two-thirds who are funding Dubya’s adventures with your paycheck, consider joining the other third who aren’t.
(I’ve written about the Lucky Duckies who don’t pay federal income tax before.
See for instance .)
The IRS has released some preliminary data about tax year , and these show that the increasing “lucky ducky” trend — the percentage of Americans living under the income tax line — has pretty much levelled off.
, the percentage of those households who filed their tax returns but were below the income tax line was in the 18%–25% range.
, the numbers have gone way up.
for which I have stats look like this:
Tax Year
Number of Zero-Tax Filers
Zero-Tax Filers as a Percent of All Filers
2004
42,500,000
32.6%
2005
43,800,000
32.6%
2006
45,700,000
33.0%
Almost a third of American households who filed tax returns paid no federal income tax at all for — either they paid none to begin with, or all of what they paid was returned to them as a refund.
Who will pay no income tax this year?
The Tax Policy Center has the numbers.
Here’s what they estimate:
This is all assuming the tax law stays more-or-less the same between now and when people file their returns .
(They don’t report the numbers on households that report negative income during the year, so I had to extrapolate this from some of their other figures.)
Note that “income” here isn’t the same as the Adjusted Gross Income shown on the tax return.
The Tax Policy Center has its own definition of “cash income” that it uses for this purpose.
The Tax Foundation puts a lot of effort into tracking down and analyzing those of us in the United States who don’t pay any federal income tax because we’re not liable for any — a group that’s been growing for more than two decades and now includes about a third of American households.
The Foundation, which subscribes to the “Lucky Ducky” interpretation of this phenomenon, sees this as a bad thing.
When they discuss it, they have a tendency to pretend there are no such things as FICA, inflation, excise taxes, corporate taxes, sales taxes and other state taxes, and so forth, and so they will claim that these lucky duckies are “nonpayers” who “have no tax liability” because their “entire tax liability” is “wiped out” by various credits and deductions that legislators use “to funnel money to groups of people they want to reward” who then end up “disconnected from the cost of government.”
The subsequent Wall Street Journal editorial about how awful the government is to the virtuous rich then just about writes itself.
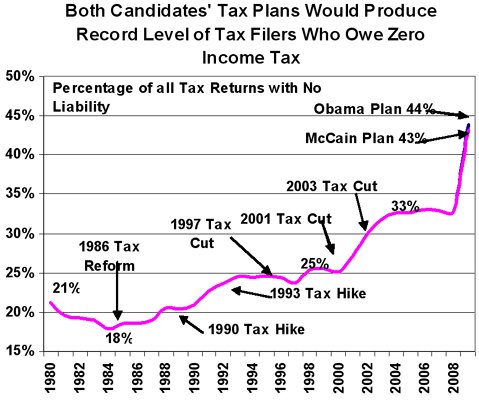
According to the most recent IRS statistics for , some 45.6 million tax filers — one-third of all filers — have no [federal income] tax liability after taking their credits and deductions.…
Tax Foundation estimates show that if all of the Obama tax provisions were enacted in , the number of these “nonpayers” would rise by about 16 million, to 63 million overall [44%].
If all of the McCain tax proposals were enacted in 2009, the number of nonpayers would rise by about 15 million, to a total of 62 million overall [43%].
Of course, all this has to be taken with a big, bumper-sticker-laden grain of salt.
Obama & McCain are promising lots of things, and neither one is likely to be faithful to those promises once it actually comes time to try to push legislation through Congress.
In recent years, the proportion of income tax filers in the United States who are “lucky duckies” — that is to say they owe no federal income tax at all over the course of the year — rose to about ⅓ and then leveled off.
Now that the election is over and the new administration has added some more details to their plan, the Tax Policy Center has run the numbers to see where things stand:
Tax Units with Zero or Negative Individual Income Tax
Legal Regime
Current Law
43.4%
40.2%
34.0%
33.2%
32.5%
Administration Baseline
43.4%
40.4%
37.7%
36.9%
36.1%
Administration Budget Proposal
43.4%
40.4%
39.5%
38.7%
37.8%
As I understand it…
“current law”
is as if Congress made no changes to the tax law as it is currently
written, although some provisions of the tax code have automatic changes
built-in and others have expiration dates
“administration baseline”
is what Obama’s team is comparing their plan to — it is like the “current
law” except that it assumes that Congress would certainly extend some
popular features of the tax code that are set to expire
“tax units”
are individuals or married couples who potentially might owe taxes, but
does not include dependents that are declared as such on the tax returns
of other “tax units”
The Tax Policy Center also includes projections of how many “tax units” will
owe neither federal income tax nor the payroll tax
(a.k.a. FICA or SECA):
Tax Units with Zero or Negative Individual Income and Payroll Tax
Legal Regime
Current Law
11.6%
11.5%
11.5%
11.4%
11.5%
Administration Baseline
11.6%
11.5%
11.8%
11.8%
11.9%
Administration Budget Proposal
11.6%
11.5%
11.8%
11.8%
11.9%
So it looks as though we’re in for another big leap in the number and
percentage of Americans who pay no federal income tax. I can’t help but think
of this as good news, but as I’ve said before, this presents a bit of a
challenge to the war tax resistance movement, which orients itself around
promoting resistance to the federal income tax — a tax that the government
seems to be making it increasingly difficult to resist by the unusually crafty
method of exempting people from it by the millions.
, I noted that the percentage of people who filed returns that indicated that they paid no federal income tax had risen slightly, to 33%.
For tax year , the percentage dropped slightly:
Tax Year
Number of Zero-Tax Filers
Zero-Tax Filers as a Percent of All Filers
42,500,000
32.6%
43,800,000
32.6%
45,700,000
33.0%
46,400,000
32.4%
(In , some people who ordinarily would not have filed a tax return — for instance because they didn’t have any income to report — filed anyway in order to claim their stimulus payment.
Those people aren’t included in the totals above).
this percentage hovered in the 18–25% range.
Then it climbed to this 32–33% plateau during the Dubya years.
, the percentage is expected to leap to 43.4% and then drift back down from there to somewhere in the 30s in subsequent years.
As you can see, the estimate of the percentage of households paying no income tax has jumped quite a bit, particularly for this year.
Also it looks as though they are projecting that Obama’s budget will lower this percentage less dramatically than in their earlier estimates:
Tax Units with Zero or Negative Individual Income Tax
, I noted that the percentage of people who filed returns that indicated that they paid no federal income tax had dropped slightly, to 32.4%.
A revised figure brings that back up to 32.6% which is typical for recent years.
But for tax year , the percentage has jumped to 36.3%:
Tax Year
Number of Zero-Tax Filers
Zero-Tax Filers as a Percent of All Filers
42,500,000
32.6%
43,800,000
32.6%
45,700,000
33.0%
46,600,000
32.6%
51,600,000
36.3%
(These numbers only represent tax filers who owed no federal income tax for the years in question; it does not include other taxes.
In tax year , some people who ordinarily would not have filed a tax return — for instance because they didn’t have any income to report — filed anyway in order to claim their stimulus payment.
Those people aren’t included in the totals above.)
this percentage hovered in the 18–25% range.
Then it climbed to this 32–33% plateau during the Dubya years.
This new 36.3% figure represents a jump, but there is an even bigger jump expected from people filing this year.
There’s a new Statistics of Income Bulletin out, with preliminary numbers from the filing season showing the number and percentage of “lucky duckies” who file tax returns showing that they owed no federal income tax all year:
Tax Year
Number of Zero-Tax Filers
Zero-Tax Filers as a Percent of All Filers
42,500,000
32.6%
43,800,000
32.6%
45,700,000
33.0%
46,600,000
32.6%
51,600,000
36.3%
58,600,000
41.7%
You’re reading that right: 41.7 percent of all households who filed tax
returns last year owed no federal income tax at all for the entire
tax year. That doesn’t mean they didn’t owe
any extra on , but that
they didn’t owe any federal income tax at all on the income they
earned in . If you paid your income taxes you
should feel like a chump.
The Tax Policy Center has crunched the numbers to try and figure out how the ranks of “lucky duckies” (those American households who aren’t required to pay income tax) will expand or shrink in the coming years based on some different policy options.
They project that for 2012, for instance, between 45.7% and 46.3% of households will pay no federal income tax.
The American conservative group “Heritage Foundation” gives us a graph that shows how the percentage of Americans has been rising who are neither federal income tax payers nor a dependent of someone who is.
Now you might think that American conservatives, who rarely have anything good to say about taxes, would be celebrating this erosion of the income tax.
But no.
The authors of the report call the “growth in the non-taxpaying public” a “worrying trend.”
And naturally, the Heritage folks conflate not paying any federal income tax with not paying any taxes at all, which makes them even more upset.
It is “particularly alarming for the fate of the American form of government,” they say, and they don’t mean that in a good way.
There’s a new Statistics of Income Bulletin out, with preliminary numbers from the filing season showing the number and percentage of “lucky duckies” who file tax returns showing that they owed no federal income tax all year:
Tax Year
Number of Zero-Tax Filers
Zero-Tax Filers as a Percent of All Filers
45,700,000
33.0%
46,600,000
32.6%
51,600,000
36.3%
58,600,000
41.7%
58,400,000
40.1%
You’re reading that right: 40.1 percent of all households who filed tax returns last year owed no federal income tax at all for the entire tax year.
That doesn’t mean they didn’t owe any extra on , but that they didn’t owe any federal income tax at all on the income they earned in .
If you paid your income taxes you should feel like a chump.
You have heard before about the rise of the “lucky duckies” — that being the Wall Street Journal editorial page’s term for the growing number of Americans who do not have to pay any federal income tax because their income is low enough to put them under the income tax line after credits and deductions.
The Journal would have us believe that this is the result of the usual government conspiracy to punish society’s virtuous and politically powerless wealth producers for the benefit of those lazy freeloaders whose poverty makes them the darling of politicians everywhere.
Or something like that.
I don’t smoke what they’re smoking, so I don’t know for sure what they’re getting at.
To some extent, this phenomenon has resulted from the “end of welfare as we know it” and its replacement by tax credits like the Earned Income Tax Credit and the Child Tax Credit.
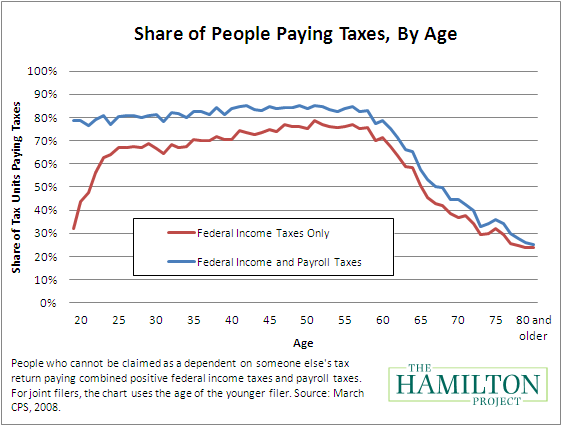
But you may have wondered to what extent this all can be explained not by such changes in the law, but by demographic changes, as the ranks of the retired grow, and people come to live off of their savings rather than their income.
Over , the number of Americans aged 25–64 is expected to rise by 9.4% while the number of Americans aged 65 or older is expected to rise by 79.2%, which will inevitably exacerbate this issue (expect the Wall Street Journal to continue blaming this on the poor and their uncannily effective Washington lobbyists).
On this blog I’ve tried to flesh out the strategy of owing no federal income tax by keeping taxable income low and qualifying for tax credits.
But Greg Mankiw reminds me that a person’s financial contributions to government may not be best measured by the amount of taxes paid, but by the amount of taxes paid minus the amount of cash benefits received.
The government measures the amount of taxes it estimates are paid by
households in the five income quintiles. And it also measures the direct
transfer payments from the government, which include:
…cash payments from Social Security, unemployment insurance, Supplemental
Security Income, Temporary Assistance for Needy Families (and its
predecessor, Aid to Families with Dependent Children), veterans’ programs,
workers’ compensation, and state and local government assistance programs.
They also include the value of in-kind benefits, such as Supplemental
Nutrition Assistance Program vouchers (formerly known as food stamps), school
lunches and breakfasts, housing assistance, energy assistance, and benefits
provided by Medicare, Medicaid, and the Children’s Health Insurance Program.
(The value of health insurance is measured on the basis of the Census
Bureau’s estimates of the average cost to the government of providing such
insurance.)
This does not include other government payments, such as pay and
benefits for government employees, payments to government contractors, and
the like. But that caveat aside, who is financially supporting the government
and who is costing it (numbers from 2009)?
quintile
average household income
government transfers to household
federal taxes paid by household
support for / cost to government
lowest income
$7,600
$22,900
$0
$−22,900
second
30,100
14,800
2,200
−12,600
middle
54,200
10,400
7,700
−2,700
fourth
86,400
7,100
15,400
8,300
highest
218,800
6,000
53,400
47,400
There are a lot of stories you can start to tell about a data table like
this, but before you start to compose one of your own, it’s good to keep in
mind that at least some of this data can be explained by the growing ranks of
retirees, who tend to have lower income, more government transfers (social
security and the like) and smaller households (meaning that per-person,
retirees swell the population of “households” in their quintile more than
others, and so may seem overrepresented in data like this).
Note also that the “government transfers” include items that are normally part
of state government budgets, but the “taxes” only include federal taxes, so
this table also exaggerates things that way.
Danny Burns’s book Poll Tax Rebellion (AK Press, 1992) tells the story of the grassroots tax resistance campaign that sank the poll tax in Britain and dragged Margaret Thatcher’s decade-long reign as British prime minister down with it.
Background
Margaret Thatcher’s span as British prime minister included a paring down of the welfare state, aggressive attempts to reduce the power of organized labor, privatization and deregulation, and a flattening of the tax rate.
You may recognize this deck of cards as being similar to what Ronald Reagan played with in this same time period (), and indeed the two were influenced by a similar set of economists and ideologues.
The poll tax was meant to replace local property taxes, which had been set on a local, council-by-council basis.
Thatcher-aligned Conservatives disliked these property taxes, which were often raised by left-leaning local councils, and which applied only to property owners (or, indirectly, to renters).
Using an argument familiar to those following current debates about the personal income tax in the United States, these critics said that because many voters did not pay these taxes, but received the benefit of the government services the taxes paid for, they were biased toward ratcheting up the tax rate to effectively confiscate and redistribute wealth from property owners, which was unfair to those taxpayers and had negative consequences in general.
To fix this problem, they believed the tax should instead be applied to everybody alike.
And in case the resulting voter pressure wasn’t enough to keep the rates down, the central government should have the ability to cap the poll tax and prevent spendthrift councils from raising it too far.
And so the poll tax was born.
It faced immediate opposition, but at first it was unclear how this opposition would take form.
The Labour party wanted people to petition and protest against the tax, but they mostly wanted people to resent it and to identify it with the Conservatives because Labour saw it as a winning issue — the party had no interest in trying to actually defeat the tax as they felt it worked to their advantage.
In addition, Labour worried that if people tried to avoid the tax, for instance by not registering as residents of a tax district, they might also try to stay off the voter rolls and thus reduce Labour’s pool of potential voters.
To those targeted by the tax, though, resentment and protest were not going to be enough.
For people at the bottom of the income and wealth scale, the poll tax was a considerable hit, and resistance wasn’t just an option, but a necessity.
Mass-resistance to the tax was organized in a strikingly grassroots fashion, often confronting antagonism not only from the government but also from establishment opposition parties and organized labor.
The resistance to the poll tax was widespread, varied, and ultimately successful.
In 1990, Thatcher resigned as prime minister and a new team took over the Conservative party and immediately flung the albatross of the poll tax from its neck, replacing it with a tiered-rate property tax.
Today I’m going to review some of the tactics that made this campaign successful.
Propaganda and spin
The very name “poll tax” was a propaganda coup for the opposition.
The government had rolled out the program with the benign-sounding name “community charge,” but the “poll tax” name stuck.
Poll taxes are never popular, and resistance to poll taxes has a resonance in British history with previous popular struggles.
The victims of the poll tax were a sympathetic lot, including pensioners, the disabled, poor families, student nurses, and people with elderly live-in family members, and the resistance movement was not shy about using this to its advantage.
Public burning of tax bills, and frequent leafletting and postering kept the resistance in the public eye and made sure people knew there was an ongoing resistance campaign.
A community arts group created a travelling performance about the poll tax and how to resist it, and enacted it in various communities.
Take pride in resistance
Some councils tried the old trick of publishing a list of people who were behind on their taxes as a way of “shaming” them before their neighbors.
Instead, when this happened, people who were resisting their taxes but who were not on the list wrote letters-to-the-editor of the periodicals where the lists appeared to ask why their names had not been included on the roster.
Myth and legend
The resistance movement summoned up images from respected tax resistance campaigns of Britain’s past as a way to make its movement seem more respectable and part of a patriotic lineage.
There were references to the women’s suffrage movement and the American revolution, but even more often to Wat Tyler’s poll tax rebellion of .
The phrase “No Poll Tax Here,” seen on many of the signs and posters used by the resistance movement, also hearkened back to the Reform Act-related tax resistance of , in which people placed “No Taxes Paid Here” signs in their windows.
(The anti-poll tax resistance was so popular and successful that nowadays it is the model hearkened back to by movements like the current resistance to the Household Tax in Ireland.)
Surveys
On at least one occasion, the resistance movement took a door-to-door survey of households both to gauge their interest in resisting, and as a pretense to spread the resistance idea.
One result of the surveys was that between the people who planned to pay, and the people who couldn’t or wouldn’t pay was a large (55%) middle-ground of people who were sympathetic with resistance and would be willing to resist if they knew enough people were with them.
On seeing this result, Burns says, “we knew that non-payment was going to be massive.”
Another clever variety of survey was this:
[One] group then mass-produced a window poster which said “No Poll Tax Here.”
The poster was dropped through the letter-boxes of 2000 households and the group waited to see who put them up.
Posters appeared in about 100 windows.
Activists the went round and spoke to these people individually, inviting them to attend the next organising meeting…
Drown them with paperwork
Implementing the poll tax required registering everyone in the United Kingdom, and keeping track of them as they moved from one council district to another.
The people who designed the poll tax program underestimated how difficult it would be to do this adequately, even if there hadn’t been a lack of enthusiasm for the project by the individual councils or outright opposition from those being taxed.
Some of the earliest resistance tactics aimed at exacerbating this problem, and the only tactic promoted by the Labour party that could be described as an actual resistance tactic falls in this category:
[The “Stop It” campaign’s] one serious initiative was the “send it back” campaign, which told activists to return the registration forms and ask awkward questions of the council officers.
Its aim was to delay the system and to make “a legitimate protest.”
Burns notes that this was of questionable effectiveness, in part because it was not pursued very vigorously, and in part because by encouraging people to register in any form — even in a temporarily obstructionist way — this provided registration information to the poll tax collecting authorities that could later be used against resisters.
Clogging the bureaucracy with paperwork was nonetheless an effective tactic, particularly later in the resistance struggle as the councils had to go through the process of pursuing those who did not pay:
…councils were inundated with correspondence.
Many people genuinely didn’t understand what the Poll Tax was about.
Others mounted campaigns to delay registration by endlessly asking questions about the form.
All of these had to be answered.
Councils sat under a mountain of paper.
Everything they did seemed to create more work.
The paper-work involved with administering the charge is enormous — and likely to get worse.
Backlogs switch from one area of activity to another.
Indeed, local authorities cannot really do anything without generating more paper-work.
If they attempt to canvas more people for registration they will also produce more people who will refuse to register.
―Poll Tax Legal Group
Make enforcement expensive
Whereas in the past, summonses issued by councils against people in arrears on their taxes had been pro forma things, rubber-stamped by judges without the summoned defendant even being expected to turn up — when people were given summonses for their poll taxes, the resistance movement encouraged them to go to court and to use whatever means they could to stretch out the time of their court appearance.
Mathematically, if even a fraction of the people summonsed actually turned up in court and were given even a few minutes of time to explain themselves, the courts would be unable to handle the load.
Local Anti-Poll Tax unions trained members in the law so they could help individual resisters stand up for their rights in court.
There were frequent examples in which thousands of summons were dismissed for technical errors or just because the courts were overwhelmed.
Warn people enforcers are coming
In a strategy modeled on one used in South Africa’s apartheid-era townships, neighborhoods declared themselves “no-go” areas for sheriffs, and posted watchouts to warn people if bailiffs or other enforcers were on the way.
Activists in Edinburgh formed a group called “Scum-busters” which was equipped with CB radios and squadrons of cars.
Telephone trees were organised; bailiff companies were monitored; their car registration numbers were taken and distributed to activists in all the local areas.
The Camden group recruited taxi firms to keep an eye out for bailiff vehicles while they did their rounds and to call in their spottings.
Try to win over tax collectors and collaborators
The movement tried, without success, to convince local councils — many of which were left-leaning and not sympathetic to Conservative policies — to resign their offices, or to illegally refuse to enact their budgets according to the poll tax law.
They also failed to convince the labor union representing the workers who worked in the bureau enacting the poll tax to refuse to implement the tax.
The movement had unexpected allies, of a sort, in the bailiffs who were assigned to distrain goods from tax defaulters.
Being used to unorganized, ashamed, impoverished pushovers, these collection agencies were overwhelmed by organized resistance and found themselves unable to recoup the expenses of collection.
For this reason some went bankrupt, while others were reluctant for merely financial reasons to handle cases of distraint for failure to pay poll tax.
Social boycott of tax collectors and collaborators
The movement also used the threat of shunning or boycott to discourage people from cooperating with the poll tax.
The government tried to recruit newsstands to be deposit points for poll tax payments, as convenient supplements for government-run depots like post offices.
But when the resistance movement got wind of this, “communities made it plain that they would no longer use the shops” of those who collaborated in this way.
Intimidate tax collectors and collaborators
In some cases, the intimidation went beyond threats of boycotts and shunning to vandalism and violence:
Windows have been smashed and graffiti daubed over businesses which have become agents… to collect the community charge… one agent in Patchway has now declined taking an agency after a brick was thrown through his window… [another] had the words “Poll Tax scab” and “you’re the first” scrawled in white paint across his window.
A Circle K store in Cardiff… had its door locks jammed with superglue.
Posters implicitly or explicitly threatening bailiffs and judges with lynch mob justice were not uncommon:
One showing a vicious dog, read “Bailiffs? Make my day!”
Another showing a picture of Malcolm X holding a machine gun [sic] looking out from behind the curtains, read: “Bailiffs we’re ready.”
A third showed a picture of a bailiff swinging in a noose.
It read “Dead bailiffs don’t knock on doors.”
In some areas bailiffs and registration officers were photographed and their portraits were reproduced on posters which read “wanted” and listed their “crimes.”
Some canvassers quit their jobs under the pressure of such violent threats, and one committed suicide with his family blaming it on being “sworn at and threatened” by those he encountered.
On one occasion, molotov cocktails were thrown at an (unoccupied) poll tax office.
A large group of protesters converged on and surrounded the home of the head of a bailiff company.
Finding him not at home, but his garage door open, they held a mock auction of his property.
Destroy or disable collection apparatus
There is one plausible story in the book of a poll tax office’s database being compromised and a large percentage of registered people being deleted from the system.
On one occasion, a bailiff’s vehicle had its tires slashed.
On another, resisters occupied the poll tax office, took up stations at the payment windows, and told people who had come by to pay their taxes to go home instead as the tax had been rescinded.
Blockades, occupations, and barricades
Several attempts by bailiffs to seize property from resisters were foiled by blockades of hundreds of protesters, several deep, surrounding the resister’s home and preventing access.
Sometimes this would extend to barricading the streets of a neighborhood, and in at least one case, of an entire town.
There were also several examples of groups of protesters occupying government and law-enforcement offices, courtrooms, and council chambers in such a way as to make business there come to a halt.
Publish and distribute how-to guides
A group of legal advisors assembled a series of bulletins and a how-to guide to help people become familiar with their legal rights and with the process the law was likely to take in their cases.
This gave them the confidence to pursue their resistance up to the limits of their comfort level, and also the techniques to make their resistance most effective.
Census resistance
Non-registration was as important as non-payment, and had to be pushed early in the campaign, while the Labour and other mainstream liberal opposition was still advising people to register but be angry about it.
When resisters were served with a liability order, it would be accompanied by a questionnaire that included questions about the resister’s employment (which could be used to help the government seize the resister’s paycheck).
Although it was legally mandatory to fill out these questionnaires, and penalties were threatened against those who refused, only about 15% of the people who received such questionnaires returned them.
Engender and maintain activism and solidarity
Everybody potentially had a role to play in the resistance.
People who did not owe tax could be legal advisors or join phone banks.
Even children served as lookouts to watch for bailiffs.
The most successful groups used a bottom-up organizing model, where most decisions were made independently in small, locally-convened groups of resisters.
This served to empower individuals and to encourage them to rely on their own initiative rather than on the decisions of a far-off activist elite.
Here’s an interesting technique for bringing people together:
An independent television company approached the Easton group in order to work with us on a film about the Poll Tax.
The film was never shown, but the way the community was engaged in the process of making it is instructive.
The film producers wanted a shot of all the doors in the street, opening one by one as the occupants came out of their houses with banners and signs.
Charles, the local street rep, went round to people’s houses every evening for a week and explained to them what was wanted.
Out of 30 houses in the street (a cul-de-sac) 28 agreed to participate.
The street is multi-racial with a fairly wide class mix.
It was inspiring to see white working class men standing shoulder to shoulder with Asian women and their kids, holding the same banners and engrossed in conversation.
Some of them had never spoken to each other before.
…[V]irtually every one of those households joined the Union, and most still had posters in their windows a year later.
People were brought into the campaign, not through a leaflet or a canvasser, but through an interesting activity.
They didn’t have to go to the campaign, it came to them.
Support and assist arrested & imprisoned resisters
When people received summonses, they could call a hotline number to get an information package in the mail.
These numbers were posted on walls and utility poles all over.
Volunteers were given legal training so that they could help summonsed people as informal legal advisors, and a more formal and credentialed legal advisory group in turn advised them.
Brian Wright, the first resister imprisoned for failure to pay, got 800 cards and letters from well-wishers while in jail, and hundreds demonstrated outside his cell.
The police cracked down on anti-poll tax demonstrations, in what seemed to the demonstrators like a deliberate attempt to turn them into bloodbaths, intimidate people from participating, and divide the movement into “lawless” and “respectable” factions.
This seemed to work to some extent, at first, as some prominent spokespeople for the anti-poll tax movement distanced themselves from those arrested for “rioting.”
But an independent group formed and dedicated itself to defending anyone arrested at these demonstrations, and organized itself in such a way as to be solely representative of the defendants (not of any other organization).
Volunteers were sent to every police station to welcome demonstrators as they were bailed out, and the organization was able to share resources (like videotape disproving police testimony) and tactics among legal teams representing different defendants.
…a prisoners support group was set up… supporting 27 long-term prisoners. …
The TSDC made sure each prisoner was written to at least once a week by members of the campaign and visits to prisoners were coordinated through the campaign.
Those who had been inside offered support and advice to those who were about to be convicted, and a newsletter was produced which published the letters of prisoners.
The campaign… paid for newspapers and books; a Walkman cassette player for every prisoner; £10 a month income (the maximum they are allowed).
In addition to this some of the families were offered limited financial support for visits…
Conclusion
The resistance campaign that defeated the poll tax was diverse and creative in its tactics, and its success makes it a model worth learning from.
Danny Burns’s book about the campaign is a helpful overview of these tactics and of the dynamics of how they were applied.
There’s a new Statistics of Income Bulletin out, with preliminary numbers from the filing season showing the number and percentage of “lucky duckies” who file tax returns showing that they owed no federal income tax all year:
Robert Fernandes of Forks Township, Pennsylvania, paid his $7,143 in property taxes with 7,143 dollar bills, as a way of making a protest against paying for public schools that his children don’t attend. “We don’t even use the public system, yet I am being forced to pay all this money into a public scool system. I don’t think that’s really either fair or just or even ethical. It would be the equivalent if McDonald’s were to force vegetarians to pay for their cheeseburgers.” Friends of Fernandes videotaped the action and put it on-line. “I wanted to create a visual,” said Fernandez, as a way to help taxpayers “see exactly how much taxes is being stolen from them.”
The percentage of households in the U.S. who are among the “lucky duckies” who pay no federal income tax is beginning to recede slightly.
But Howard Gleckman, at the Forbes blog, wonders if we’ve been overcounting ducks this whole time.
There are a surprising number (millions) of people in the U.S. who fail to file income tax returns even though they have had taxes deducted from their meager wages all year and are probably due refunds.
Because they don’t file returns, they are usually categorized as non-paying “lucky duckies” — but because they have had taxes withheld from their paychecks, they really don’t belong in that category.
Voters in Colorado decided to finally legalize recreational marijuana use.
But the prohibitionists are fighting back by trying to enact a prohibitive tax on marijuana that would effectively recriminalize it — forcing it back into the black market and erasing many of the benefits of legalization.
Legalization promoters there responded with a free marijuana give-away program in Denver (some coverage here, here, here, and here).
There’s a
new Statistics of Income Bulletin out, with preliminary numbers from the
filing season that show the number and
percentage of “lucky duckies” who file tax returns showing that they owed no
federal income tax all year:
Tax Year
Number of Zero-Tax Filers
Zero-Tax Filers as a Percent of All Filers
42,500,000
32.6%
43,800,000
32.6%
45,700,000
33.0%
46,600,000
32.6%
51,600,000
36.3%
58,600,000
41.7%
58,400,000
40.9%
53,700,000
36.9%
51,800,000
35.7%
The IRS has released some preliminary tax year numbers, showing the number and percentage of “lucky duckies” who file tax returns showing that they owed no federal income tax all year.
The number seems pretty close to the number:
Tax Year
Number of Zero-Tax Filers
Zero-Tax Filers as a Percent of All Filers
42,500,000
32.6%
43,800,000
32.6%
45,700,000
33.0%
46,600,000
32.6%
51,600,000
36.3%
58,600,000
41.7%
58,400,000
40.9%
53,700,000
36.9%
51,800,000
35.7%
52,884,018
35.8%
The IRS has released some preliminary tax year numbers.
These show, among other things, the number and percentage of “lucky duckies” who file tax returns showing that they owed no federal income tax all year:
Tax Year
Number of Zero-Tax Filers
Zero-Tax Filers as a Percent of All Filers
42,500,000
32.6%
43,800,000
32.6%
45,700,000
33.0%
46,600,000
32.6%
51,600,000
36.3%
58,600,000
41.7%
58,400,000
40.9%
53,700,000
36.9%
51,800,000
35.7%
52,884,018
35.8%
52,074,353
35.0%
Some bits and pieces from here and there:
The New England Gathering of War Tax Resisters is going to be held in Hardwick, Massachusetts.
Details will be posted to the NWTRCC website eventually.
From a tax-evasion point of view, they are particularly attractive.
Cryptocurrencies possess the two most important characteristics of a traditional tax haven.
First, because there is no jurisdiction in which they operate (they are “held” in cyberspace accounts known as online “wallets”), they are not subject to taxation at source.
Second, cryptocurrency accounts are anonymous.
Users can start as many online “wallets” as they want to buy or mine Bitcoins and trade them without ever providing any identifying information.
Significantly, Bitcoin (and other cryptocurrencies) offer one additional major advantage to tax-evaders that traditional tax havens do not: the operation of Bitcoin is not dependent on the existence of financial intermediaries such as banks.
Bitcoin is exchangeable peer-to-peer by definition.
Bitcoin thus seems immune to the developing international anti-evasion regime [in which] financial institutions [are] the emerging agents of tax collection…
Thus, cryptocurrencies have the potential to become super tax havens.
Bitcoin transactions are not anonymous by default.
Indeed, there is a permanent record of every bitcoin transaction that is fully available to law enforcement.
If you want to use bitcoin anonymously you have to take careful steps to do so.
There’s a bit of interesting background in this IRS research paper about the process the agency goes through when it detects that someone has failed to file a tax return.
The IRS has released some preliminary tax year numbers.
These show, among other things, estimates of the number and percentage of “lucky duckies” who file tax returns showing that they owed no federal income tax all year.
So I’ve added another line at the bottom of the table:
Tax Year
Number of Zero-Tax Filers
Zero-Tax Filers as a Percent of All Filers
42,500,000
32.6%
43,800,000
32.6%
45,700,000
33.0%
46,600,000
32.6%
51,600,000
36.3%
58,600,000
41.7%
58,400,000
40.9%
53,700,000
36.9%
51,800,000
35.7%
52,884,018
35.8%
52,074,353
35.0%
51,355,566
34.1%
Congress is wrapping up its tax legislation.
Here is some of what I’ve learned about it — particularly those parts that might be important to people trying to eliminate their income tax as I do, by keeping our incomes low:
This is expected to be costly to the U.S. Government.
It is projected to lead to the government collecting $1 trillion dollars fewer in taxes over the next decade.
This will likely show up as increased government debt, as the Republicans had a hard enough time doing the easy part (lowering taxes) and are unlikely to be able to muster enough courage to do the hard part (reducing spending).
Republican optimists hope that by keeping this $1 trillion out of government hands and in the private sector, the economy will boom, leading to higher tax receipts after all, and so things will all balance out in the end.
People who know how to run the numbers, though, don’t seem to be taking that scenario seriously.
The bill reduces both corporate and individual tax rates.
But for a lot of people, what really controls how much they’ll pay is not their rate, but how much of their income is subject to the income tax and how much is safely deducted out of harm’s reach.
In any case, the lowest of the rates (10%) remains the same as before and covers just about the same amount of taxable income, so from the point of view of a low-income tax resister like myself, nothing much has changed here.
Next year, the standard deduction had been scheduled to go up to $6,500, and the personal exemption to $4,150 — shielding $10,650 of a single person’s income from income tax.
The new legislation eliminates the personal exemption, but boosts the standard deduction to $12,000 — thereby adding $1,350 to the amount that’s shielded in this way (people filing as married-joint, married-separate, or head-of-household also see rises to their standard deductions).
Modifications to the child tax credit and credits for non-child dependents are meant to make up for the absent personal exemption for people with dependents.
The bill eliminates some itemized deductions, but also eliminates the limitation on how much of such deductions you can take if you’re well-off.
You will also be able to take a slightly higher proportion of your Adjusted Gross Income (60%, up from 50%) as a deduction for charitable contributions, and the law will become somewhat more generous about allowing you to take a deduction for medical expenses.
I haven’t looked into this very closely, but it’s possible that this holds out some hope to high-rollers that they might eliminate their federal income tax through zealously pursuing itemized deductions.
The bill would allow you to use tax-advantaged education savings accounts to pay for a child’s tuition at a private elementary/secondary school (in the past, these accounts could only be used for post-secondary education).
This could be a useful tax shelter for people who would prefer not to inflict government-run schooling on their children.
It’s surprising to me just how little actual change there is from the status quo.
Everybody complains about the complexity of filing their income taxes, and politicians get lots of mileage about promising to let people file on the back of a postcard and the like.
But after all of the wrangling, this new bill keeps the individual Alternative Minimum Tax and doesn’t even reduce the number of tax brackets — the cheapest trick in the “simplification” bag.
It even introduces a lot of new complexity by means of its new method of taxing “pass-through” income — something that may cause some new headaches (or, may we hope, offer new tax-saving opportunities) to those of us with Schedule C income from sole proprietorships, gig economy work, or small businesses.
I was also a little surprised to see neither the House nor Senate try to boost Health Savings Accounts.
These are a more Republican-identified health care policy reform measure, and I would have thought that as they try to sabotage Obamacare that they would have put some effort into bolstering some of their own alternative ideas.
No such luck.
It makes me wonder if maybe Health Savings Accounts are a craze that has come and gone and that we might expect the program to atrophy at some point.
The Tax Policy Center estimates that the new tax law will result in more “lucky duckies” — people who owe zero federal income tax — than were expected under the law as it stood before the new legislation passed.
Before, 43.4% of non-dependent Americans were expected to fall into this fortuitous category; now 45.8% are.
Today I’ll share some links about tax policy and tax resistance in the United States that have caught my attention recently.
First, though: I’ve started a Wikipedia page on Tax resistance in the United States that covers how theories about tax resistance have shaped (and been shaped in) the U.S., and how tax resistance in practice has played out in the country.
Wikipedia is an open, collaborative project that anyone can help to edit, so I encourage you to learn what it’s all about and how to help make it better.
Now on to the links:
Tax Evasion
The New York Times got its hands on a trove of financial documents concerning the real estate empire of Fred C. Trump, Donald Trump’s father, and published a well-done exposé on what they found.
From the point of view of today’s political squabbles and tomorrow’s history lessons, the takeaway is that Donald Trump’s brand, in which he is represented as a self-made business prodigy, is a laughable con job.
From our vantage, however, what’s interesting is the extent to which the Trump family used legal, effectively-legal, and illegal methods to evade taxes.
They paid a fraction of what they owed, again and again.
This may help bolster the widespread feeling that rich people commonly get away with tax evasion, sticking it to the little guy.
This in turn erodes “tax morale” which causes voluntary tax compliance to fall.
Another bit of journalism hammering on this theme (though more free-wheeling and not as methodically precise) comes from GQ: “How Puerto Rico Became the Newest Tax Haven for the Super Rich”.
Apparently if you can convince the IRS that you’ve become a permanent resident of the U.S. Territory of Puerto Rico, you’ll find yourself in “the only place on U.S. soil where personal income from capital gains, interest, and dividends are untaxed.”
General Government Failure
“The federal government could soon pay more in interest on its debt than it spends on the military, Medicaid or children’s programs.”
Thus begins a New York Times article on the growing federal government debt.
“Within a decade, more than $900 billion in interest payments will be due annually, easily outpacing spending on myriad other programs. Already the fastest-growing major government expense, the cost of interest is on track to hit $390 billion next year, nearly 50 percent more than in 2017, according to the Congressional Budget Office.”
The more the federal government is reduced to being a collection agency for bondholders, the less mischief it can get up to elsewhere.
Far from addressing this problem, today’s policymakers are exacerbating it, so we have more such headlines to look forward to.
The National Taxpayer Advocate says that the IRS is cooking the books when they report their numbers on how their phone “customer” service is doing just fine.
For one thing, they don’t measure the phone numbers with the worst service.
For another, they don’t count getting tangled up in an unhelpful “press X for Y” phone menu and then hanging up in frustration as an unsuccessful call.
For another, they count merely talking to an IRS operator as a successful call, whether the operator was able to resolve the problem or not.
Republicans are prone to complain about the percentage of U.S. households who are so poor they don’t have to pay income tax (remember Mitt Romney’s revealing “47%” comments way back when?
Or the Wall Street Journal’s “lucky duckies” editorials?).
But that didn’t stop them from crafting their major tax legislation (the recent “Tax Cuts and Jobs Act”) in such a way that it will increase the percentage of American households who pay no federal income tax.
The Tax Policy Center estimates that fully 44% of American households will pay no federal income taxes at all (2% more than ).
About 25% will pay no payroll tax either, or their payroll tax will be offset by a refundable income tax credit.
“Millennials” (says the New York Times)
are joining together to swap techniques for quitting the rat race and retiring early, in something called “the FIRE movement.”
They begin to live more frugally, squirrel things away, take greater care of their investment decisions, and eye an early modest retirement or semi-retirement.
Most of the examples in the article are of pretty well-off people who really just needed to stop living at or above the lifestyle they could afford.
But it’s people like them who pay the taxes, and by stepping off the treadmill, they stop doing so or at least stop doing so much.
So if you know anyone in that category, send them a link.
About ten years ago the number of Americans renouncing their U.S. citizenship began to shoot up, from what had been a normal range of two to eight hundred people a year to a high of 5,409 people in .
But things seem to have leveled off since then.
Why?
Your guess is as good as mine, maybe better.
While I wasn’t paying attention, the IRS released its preliminary tax year income tax filing figures.
These show, among other things, estimates of the number and percentage of “lucky duckies” who file tax returns showing that they owed no federal income tax all year.
So I’ve added another line at the bottom of the table:
Tax Year
Number of Zero-Tax Filers
Zero-Tax Filers as a Percent of All Filers
42,500,000
32.6%
43,800,000
32.6%
45,700,000
33.0%
46,600,000
32.6%
51,600,000
36.3%
58,600,000
41.7%
58,400,000
40.9%
53,700,000
36.9%
51,800,000
35.7%
52,884,018
35.8%
52,074,353
35.0%
51,355,566
34.1%
50,128,998
33.3%
The IRS has released its tax year income tax filing figures.
These show, among other things, estimates of the number and percentage of “lucky duckies” who file tax returns showing that they owed no federal income tax all year.
So I’ve added another line at the bottom of the table:
Tax Year
Number of Zero-Tax Filers
Zero-Tax Filers as a Percent of All Filers
42,500,000
32.6%
43,800,000
32.6%
45,700,000
33.0%
46,600,000
32.6%
51,600,000
36.3%
58,600,000
41.7%
58,400,000
40.9%
53,700,000
36.9%
51,800,000
35.7%
52,884,018
35.8%
52,074,353
35.0%
51,355,566
34.1%
50,128,998
33.3%
43,925,301
30.7%
Some recent links of interest:
In recent years, something in the neighborhood of 40–45% of American households have not owed any federal income tax.
This is due to a combination of factors including progressive tax rates and tax deductions & credits that shield a certain amount of income from tax.
Although fabulously wealthy people who do not pay income tax are certainly a thing, most of this group of “lucky duckies” come from the bottom half of the income scale.
In , with its pandemic-related economic disruption and the stimulus payments that took the form of refundable tax credits, the numbers jumped: the Tax Policy Center estimates that 61% of U.S. households paid no federal income tax .
Under a newish law the U.S. government will be issuing advance “Child Tax Credits” to qualifying families with children as checks periodically throughout the year.
These checks take the place of the refundable tax credit that such families would have used to offset their federal taxes at annual tax filing time in past years.
Interestingly, the IRS has directed its enforcement personnel to avoid seizing money from bank accounts in which these Child Tax Credits have been direct-deposited and to refund any inadvertently seized Child Tax Credits.
“Council Tax Strike” is a subproject of the Extinction Rebellion movement in the U.K. They claim: “There are people all over the U.K. withholding their council tax and demanding action on the things that matter to them.”
The National Catholic Reporter looks back on the nuclear disarmament activism of Archbishop Raymond Hunthausen:
“ ‘I think the teaching of Jesus tells us to render to a nuclear-armed Caesar what that Caesar deserves — tax resistance.
And to begin to render to God alone that complete trust which we now give, through our tax dollars, to a demonic form of power,’ he said in his ‘Faith and Disarmament’ speech.
‘Some would call what I am urging “civil disobedience.”
I prefer to see it as obedience to God.’ ”
The percentage of U.S. tax-filers who pay no federal income tax at all jumped during the pandemic to nearly 60%, but, according to the Tax Policy Center, the numbers are expected to drop this year back to the pre-pandemic level of about 40%.