In response to ’s post about “lucky duckies,” which included a graph showing the growing number of Americans who don’t pay federal income tax, reader “gj” asked: Where is the complementary chart for corporations?
Then he tried to answer his own question, and shares the results of his research with us:
- In , Bill Moyers says corporations pay 8% of national tax burden.
- And an update that just says it’s worse.
- Interesting take. Instead of corporate tax as % of government income, instead corp tax as % of GDP.
- The share that corporate tax revenues comprise of total federal tax revenues also has collapsed, falling from an average of 28 percent of federal revenues in and 21 percent in to an average of about 10 percent .
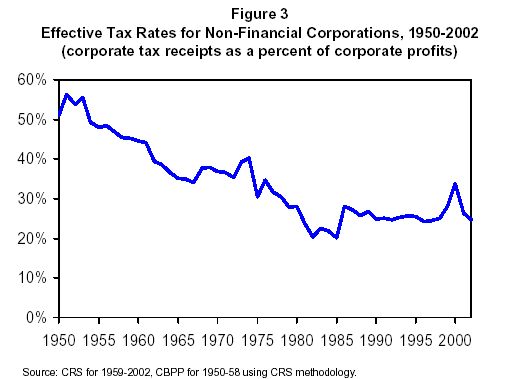
- The effective corporate tax rate — that is, the percentage of corporate profits that is paid in federal corporate income taxes — has followed a similar pattern. During , corporations as a group paid an average of 25.3 percent of their profits in federal corporate income taxes, according to new Congressional Research Service estimates. By contrast, they paid more than 49 percent in , 38 percent in , and 33 percent in
- A dubious source but perhaps a lead:
| Decade | Personal Income Tax | Corporate Income Tax | Payroll Tax | Excise/Estate | Borrowing |
|---|---|---|---|---|---|
| 42.0% | 26.9% | 11.5% | 17.2% | 2.5% | |
| 42.0% | 20.4% | 18.4% | 14.9% | 4.4% | |
| 40.3% | 13.3% | 27.7% | 11.3% | 11.1% | |
| 38.0% | 7.7% | 29.2% | 8.2% | 17.7% |
